Characterization of the HuMicA

Author

Ricardo Martins-Ferreira

Characterization of the HuMicA integrated object

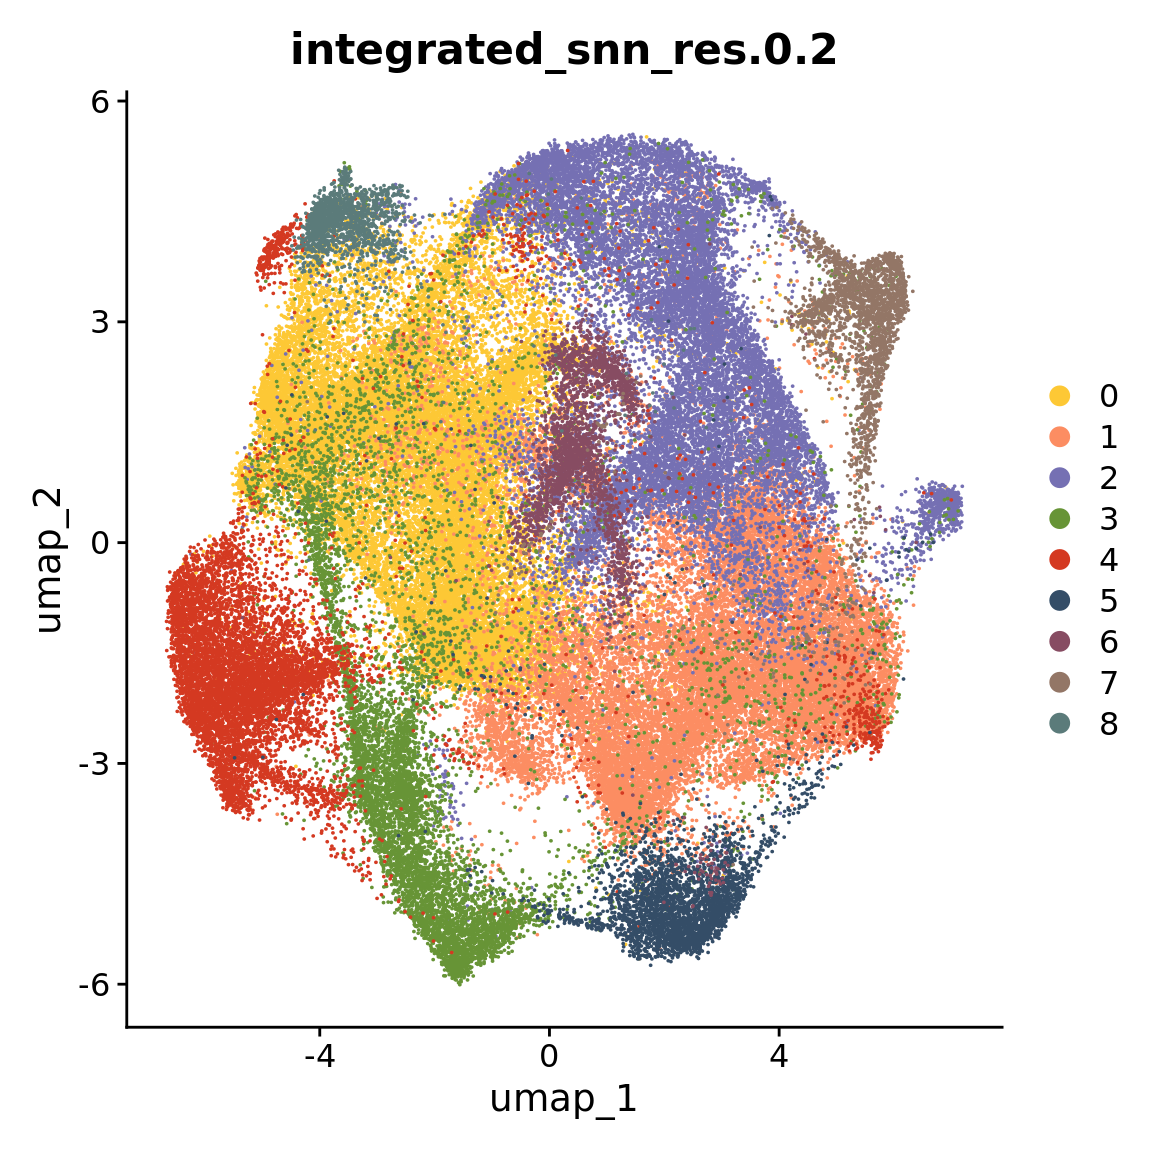
The following script depicts the identification and characterization of the nine populations within the HuMicA, and relates to the results represented in Figure 1 of the paper.

Load required packages

libs <- c("Seurat", "tidyverse", "gplots", "ComplexHeatmap","circlize","readxl", "fgsea","ggpubr")
suppressMessages(
suppressWarnings(sapply(libs, require, character.only =TRUE))
)
        Seurat      tidyverse         gplots ComplexHeatmap       circlize 
          TRUE           TRUE           TRUE           TRUE           TRUE 
        readxl          fgsea         ggpubr 
          TRUE           TRUE           TRUE 

UMAP plot

color_clusters <-c("#fdc835ff", "#FC8D62", "#7570B3" ,"#679436", "#D43921" ,"#344D67", "#874C62" ,"#937666", "#5B7B7A" )
DefaultAssay(Humica)<-"integrated"
DimPlot(Humica, reduction = "umap", order = rev(levels(Idents(Humica))),
        cols = color_clusters, 
        group.by = "integrated_snn_res.0.2", raster = FALSE,pt.size =0.001)

Number of cells/nuclei and mean genes per cell/nucleus

The number of cells/nucleis and the mean number of genes per cell/nucleus were calculated for each cluster and represented in a barplot.

cluster0<- Humica[,Humica@meta.data$integrated_snn_res.0.2=="0"]
cluster1<- Humica[,Humica@meta.data$integrated_snn_res.0.2=="1"]
cluster2<- Humica[,Humica@meta.data$integrated_snn_res.0.2=="2"]
cluster3<- Humica[,Humica@meta.data$integrated_snn_res.0.2=="3"]
cluster4<- Humica[,Humica@meta.data$integrated_snn_res.0.2=="4"]
cluster5<- Humica[,Humica@meta.data$integrated_snn_res.0.2=="5"]
cluster6<- Humica[,Humica@meta.data$integrated_snn_res.0.2=="6"]
cluster7<- Humica[,Humica@meta.data$integrated_snn_res.0.2=="7"]
cluster8<- Humica[,Humica@meta.data$integrated_snn_res.0.2=="8"]

#
main.list <- list(cluster0, cluster1, cluster2,cluster3, cluster4, cluster5,
                  cluster6, cluster7, cluster8)

my.files <-c("cluster0", "cluster1", "cluster2","cluster3", "cluster4", "cluster5",
             "cluster6", "cluster7","cluster8")

df <- data.frame(Sample=my.files, Nuclei="", Genes="")
number_nuclei= numeric(length(my.files))
number_genes = numeric(length(my.files))

for (i in 1:length(main.list)) {
  
  number_nuclei[i]<- nrow(main.list[[i]]@meta.data)
  number_genes[i] <- mean(main.list[[i]]@meta.data$nFeature_RNA)
}

df$Nuclei = number_nuclei
df$Genes = number_genes
df$Genes = format(round(df$Genes, 0))

df$Label <- paste0(df$Nuclei,"(",df$Genes,")")
df <- df[order(df$Nuclei),]
df
    Sample Nuclei Genes       Label
9 cluster8   1563  1305  1563(1305)
8 cluster7   2425  1281  2425(1281)
7 cluster6   2616  1468  2616(1468)
6 cluster5   3195  1303  3195(1303)
5 cluster4   8559  1344  8559(1344)
4 cluster3   8635  1069  8635(1069)
3 cluster2  16186  1371 16186(1371)
2 cluster1  21974  1281 21974(1281)
1 cluster0  25563  1281 25563(1281)
ggplot(df, aes(x= factor(df$Sample, levels = df$Sample), y=Nuclei, fill=factor(Sample,levels =rev(Sample) ))) +
  geom_bar(stat="identity",position = "stack")+
  geom_text(aes(label = Label), hjust=0,position = position_fill(vjust = 0), size = 3,colour="black")+
  coord_flip()+
  ylab(label = "Nuclei (mean genes/nuclei)")+
  scale_fill_manual(values = color_clusters)+
  theme_linedraw()+
  theme(panel.grid.major = element_blank(), panel.grid.minor = element_blank(), axis.text = element_text(colour="black")) +NoLegend()

Identification of border-associated macrophages

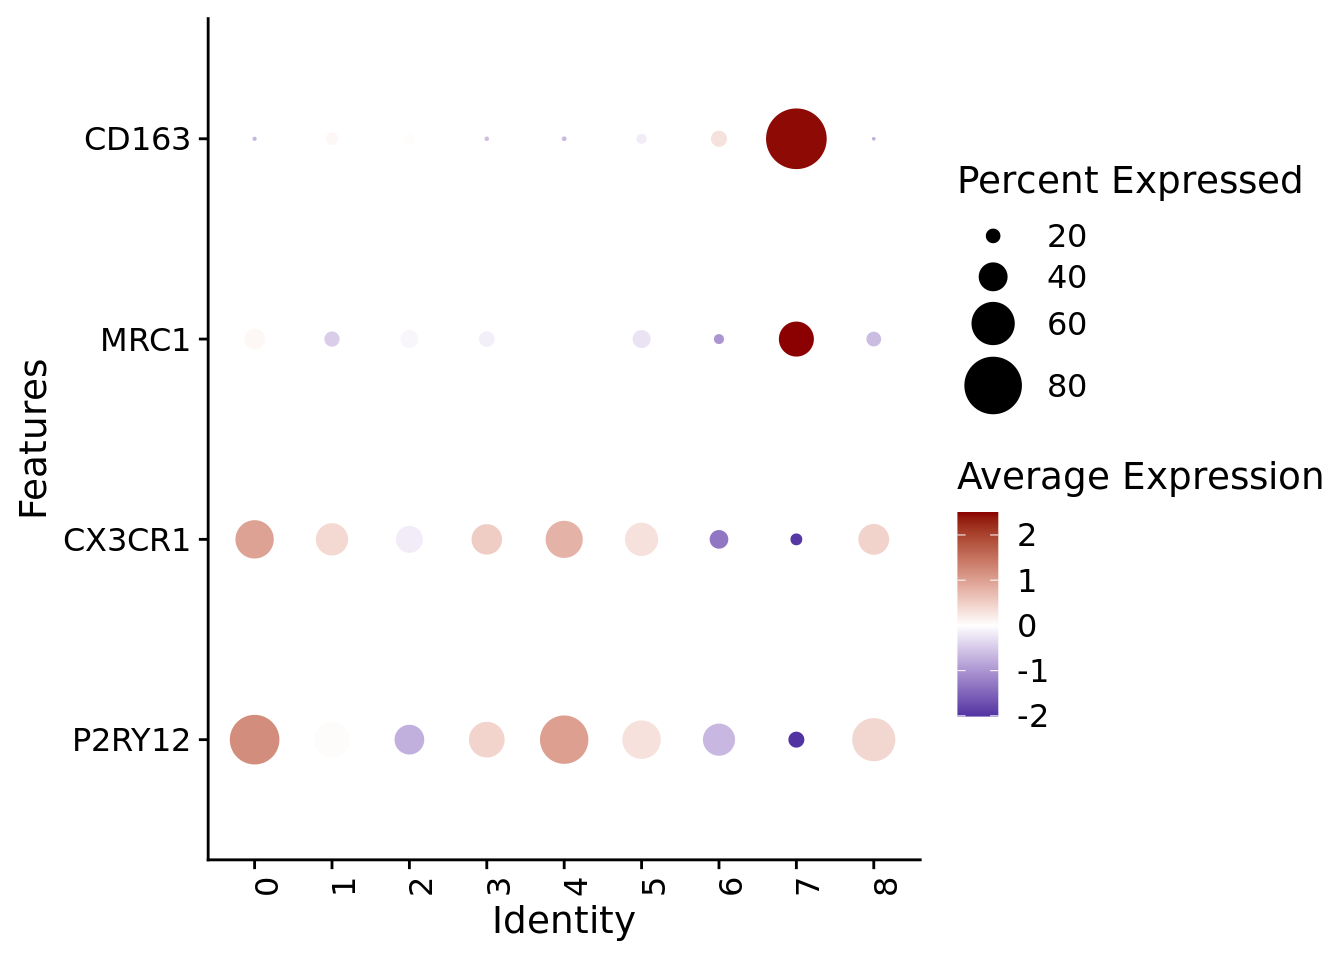
The prevalence of border-associated macrophages within the HuMicA was tested by checking the expression of canonical microglia (P2RY12, CX3CR1) and macrophage markers (MRC1, CD163). Based on this, we annotated cluster 7 as macrophages.

DefaultAssay(Humica)<-"RNA"
Humica <- NormalizeData(Humica) #gene expression is evaluated using the normalized "RNA" assay

# Dotplot
DotPlot(Humica, features = c("P2RY12","CX3CR1", "MRC1","CD163"), dot.scale = 10, group.by ="integrated_snn_res.0.2") +
  scale_colour_gradient2(low = "darkblue", mid = "white", high = "darkred")+
  #scale_color_viridis_c() +
  theme(axis.text.x = element_text(angle=90, hjust = 0))+coord_flip()
Scale for colour is already present.
Adding another scale for colour, which will replace the existing scale.

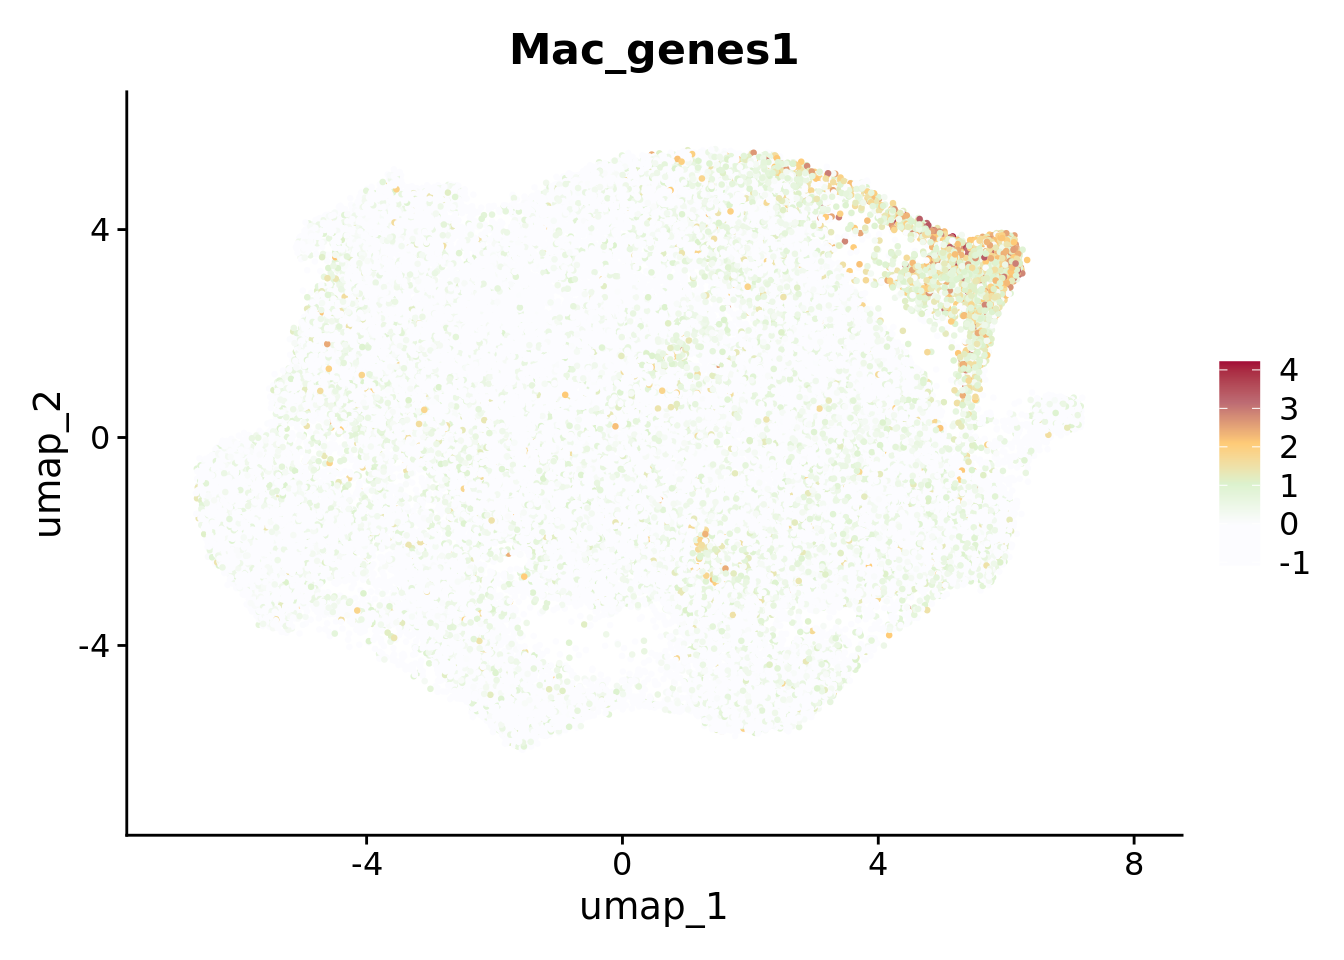
# Feature plot of the Module Score of macrophage markers
Mac_genes <- c("MRC1","CD163")
Humica <- AddModuleScore(Humica,
                         features =list(Mac_genes),
                         name='Mac_genes')
FeaturePlot(Humica, features = 'Mac_genes1', label = F, repel = TRUE,pt.size = 0.5) & scale_colour_gradientn(colours = c("#FCFCFF","#FCFCFF","#DCF2CE","#FFCB77","#BD6B73","#A30B37"))
Scale for colour is already present.
Adding another scale for colour, which will replace the existing scale.

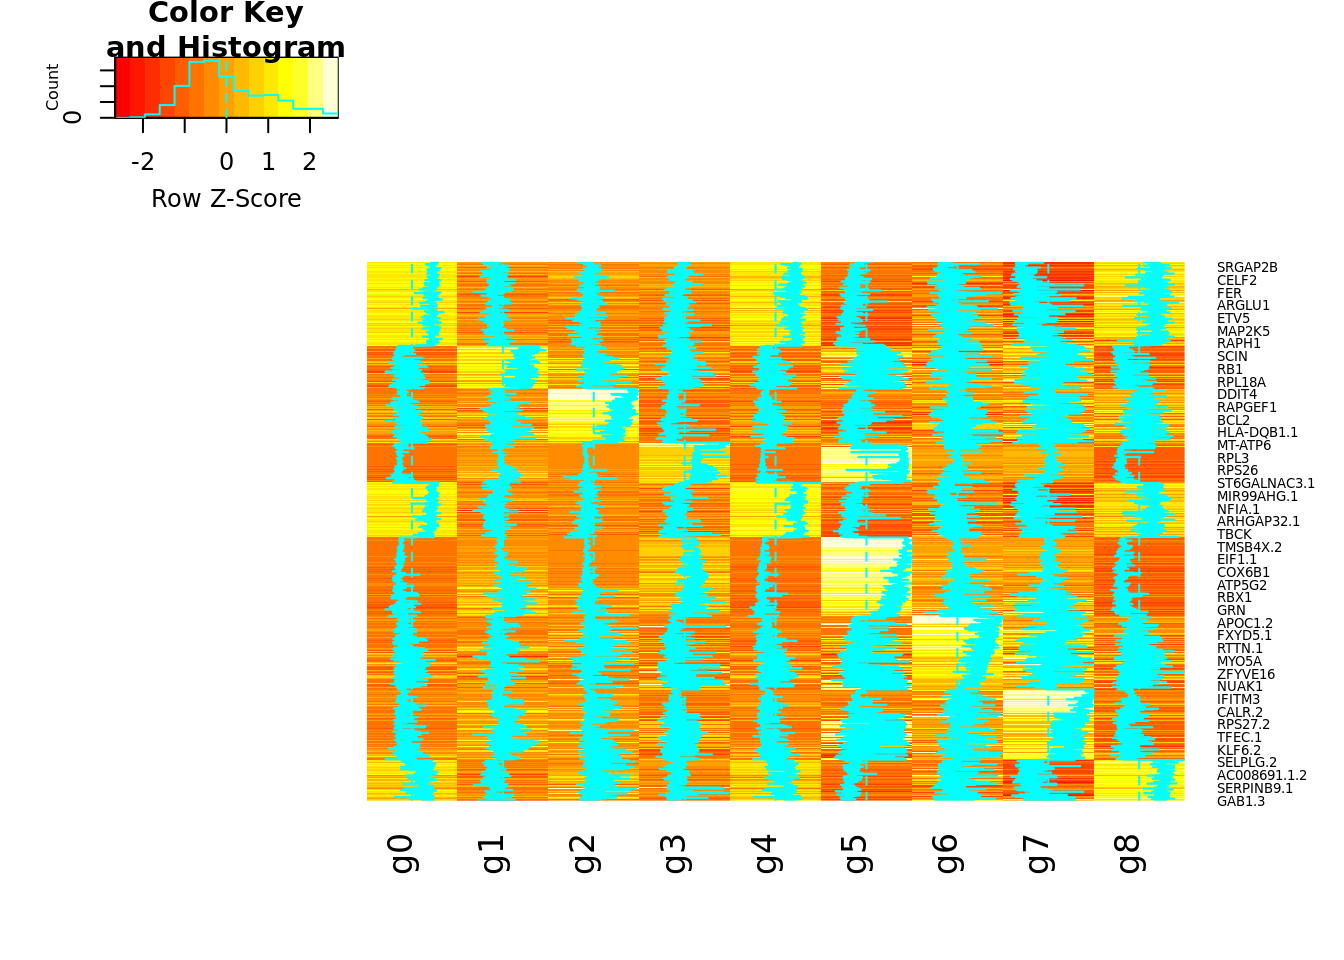
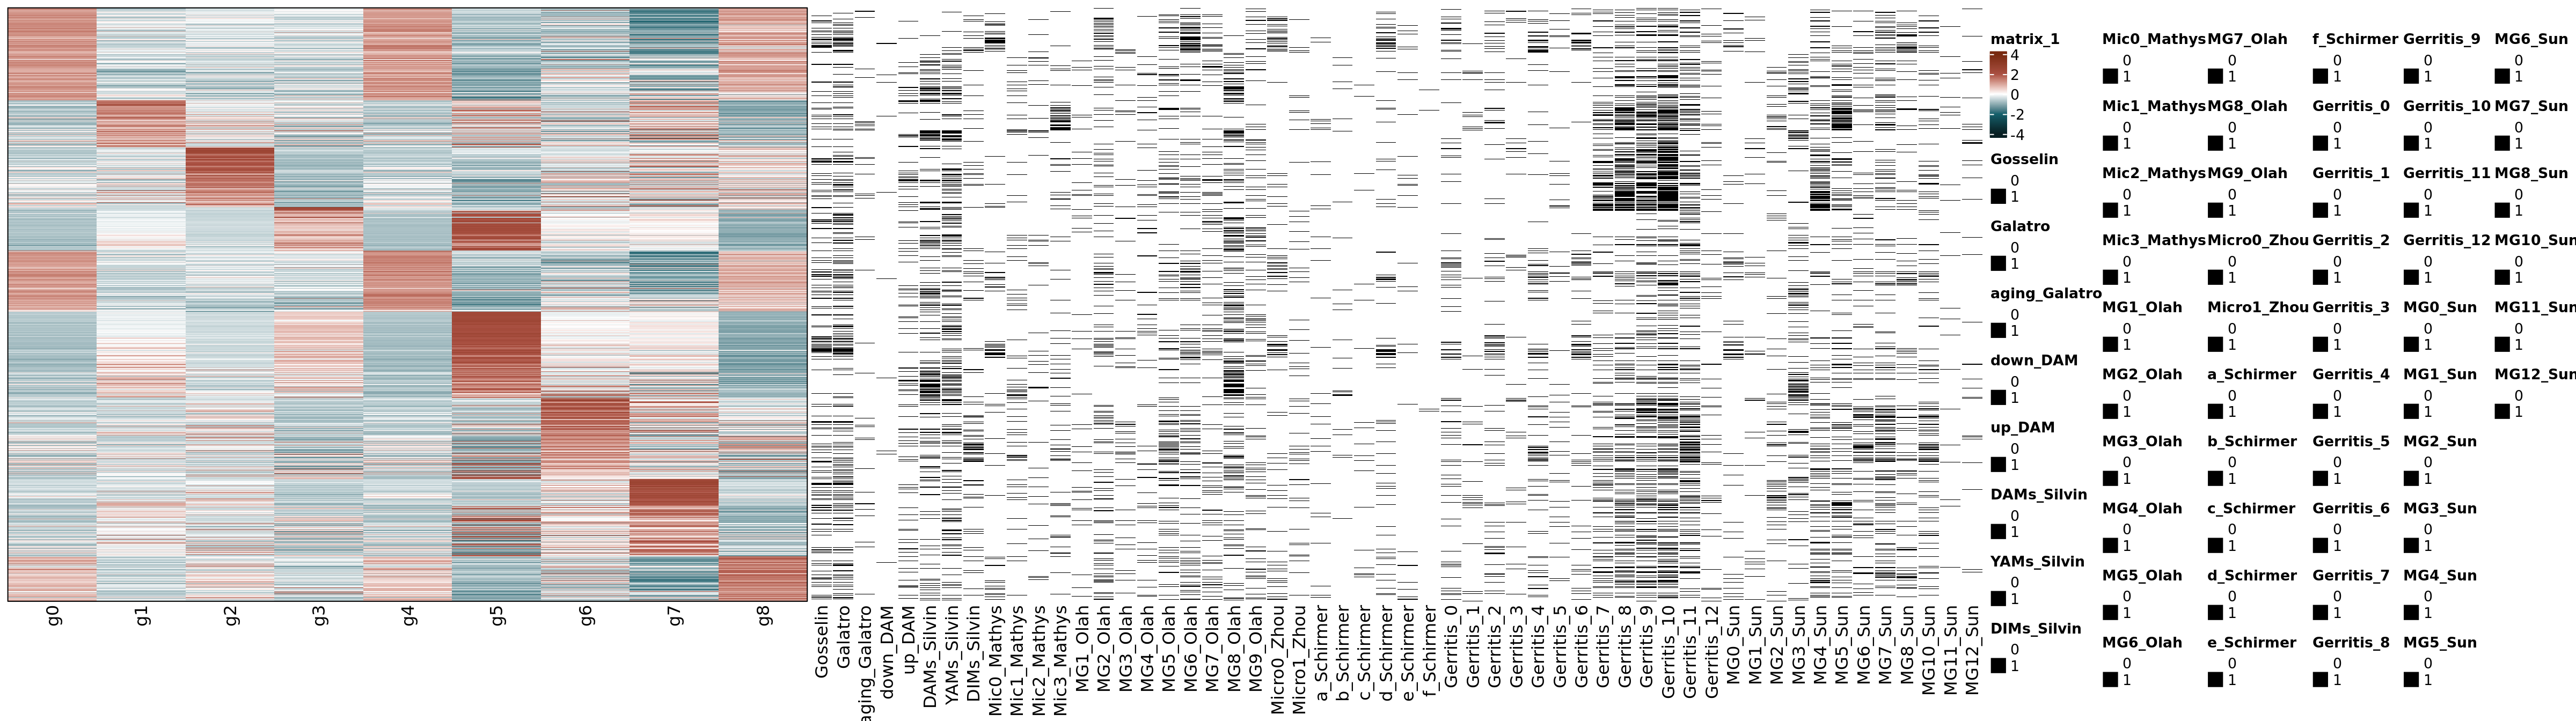
Heatmap of the cluster markers

The markers for each cluster were calculated using FindAllMarkers with the MAST test, min.pct=0.25 and logfc.theshold=0.25. Significant markers were considered for an adj p value (FDR) < 0.05.

Humica.markers <- FindAllMarkers(Humica,assay = "RNA", only.pos = TRUE, min.pct = 0.25, logfc.threshold = 0.25, test.use = "MAST") 
sig_markers <- Humica.markers[Humica.markers$p_val_adj<0.05,]

Heatmap

The heatmap represents the average gene expression per cluster, which consists of the average expression of all cells/nuclei annotated to each cluster. The heatmap.2 function from gplots is initially used to obtain the z-scores. Then the matrix with the z-scores is represented by the Heatmap function of ComplexHeatmap. In addition, the matching between the genes in the heatmap and microglia-related gene signatures collected from the literature is represented on the left panel. Each black lines represents the presence of one of the markers within each geneset/signature. The “Genesets_literature.xlsx” file has bee added to this repository (“Support data”).

Humica@active.ident <- factor(x = Humica@active.ident, levels = c("0","1","2","3","4","5","6","7","8"))
av.exp_cluster <- AverageExpression(Humica)$RNA %>% data.frame()

genes <- sig_markers$gene
  
mat <- as.matrix(av.exp_cluster[genes,])

heatmap <- heatmap.2(mat,Colv = F, Rowv = F, scale="row")

mat_scale <- t(heatmap$carpet)

col_fun = colorRamp2(c(-4,-2,0,2, 4), c("#071E22","#15616D", "white","#AA5042","#78290F"))
genesets$genesets <- paste0(genesets$Population, "_",genesets$Study)
data <- genes %>% as.data.frame(); colnames(data) <- "Gene"

geneset_list <- c("Human_microglia_signature_Gosselin","Microglia_signature_Galatro","up_aging_Galatro",
                  "down_DAM_Keren_shaul_Thrupp","up_DAM_Keren_shaul_Thrupp",
                  "Human_Adult_DAMs_Silvin", "Human_Adult_YAMs_Silvin","Human_Adult_DIMs_Silvin", 
                  "Mic0_Mathys","Mic1_Mathys","Mic2_Mathys","Mic3_Mathys",
                  "MG1_Olah","MG2_Olah","MG3_Olah","MG4_Olah","MG5_Olah","MG6_Olah","MG7_Olah","MG8_Olah","MG9_Olah",
                  "Micro0_Zhou","Micro1_Zhou",
                  "a_Schirmer","b_Schirmer","c_Schirmer","d_Schirmer","e_Schirmer","f_Schirmer",
                  "0_Gerritis","1_Gerritis","2_Gerritis","3_Gerritis","4_Gerritis","5_Gerritis","6_Gerritis","7_Gerritis","8_Gerritis","9_Gerritis",
                  "10_Gerritis","11_Gerritis","12_Gerritis",
                  "MG0_Sun","MG1_Sun","MG2_Sun","MG3_Sun","MG4_Sun","MG5_Sun","MG6_Sun","MG7_Sun","MG8_Sun","MG10_Sun","MG11_Sun","MG12_Sun")

hits <- data.frame(Gene=data$Gene)
for (i in 1:length(geneset_list)) {
  
df <- data %>% mutate(hit=ifelse(data$Gene %in% genesets[genesets$genesets==geneset_list[i],]$Gene, y="1",no = "0"))
df<-df[,2] %>% as.data.frame()
colnames(df)<- geneset_list[i]

hits<- cbind(hits, df) 
}


row_ha <- rowAnnotation(Gosselin = hits$Human_microglia_signature_Gosselin, 
                        Galatro = hits$Microglia_signature_Galatro, 
                        aging_Galatro = hits$up_aging_Galatro,
                        down_DAM = hits$down_DAM_Keren_shaul_Thrupp,
                        up_DAM = hits$up_DAM_Keren_shaul_Thrupp,
                        DAMs_Silvin=hits$Human_Adult_DAMs_Silvin,
                        YAMs_Silvin=hits$Human_Adult_YAMs_Silvin,
                        DIMs_Silvin=hits$Human_Adult_DIMs_Silvin,
                        Mic0_Mathys=hits$Mic0_Mathys,
                        Mic1_Mathys=hits$Mic1_Mathys,
                        Mic2_Mathys=hits$Mic2_Mathys,
                        Mic3_Mathys=hits$Mic3_Mathys,
                        MG1_Olah=hits$MG1_Olah,
                        MG2_Olah=hits$MG2_Olah,
                        MG3_Olah=hits$MG3_Olah,
                        MG4_Olah=hits$MG4_Olah,
                        MG5_Olah=hits$MG5_Olah,
                        MG6_Olah=hits$MG6_Olah,
                        MG7_Olah=hits$MG7_Olah,
                        MG8_Olah=hits$MG8_Olah,
                        MG9_Olah=hits$MG9_Olah,
                        Micro0_Zhou=hits$Micro0_Zhou,
                        Micro1_Zhou=hits$Micro1_Zhou,
                        a_Schirmer=hits$a_Schirmer,
                        b_Schirmer=hits$b_Schirmer,
                        c_Schirmer=hits$c_Schirmer,
                        d_Schirmer=hits$d_Schirmer,
                        e_Schirmer=hits$e_Schirmer,
                        f_Schirmer=hits$f_Schirmer,
                        Gerritis_0=hits$`0_Gerritis`,
                        Gerritis_1=hits$`1_Gerritis`,
                        Gerritis_2=hits$`2_Gerritis`,
                        Gerritis_3=hits$`3_Gerritis`,
                        Gerritis_4=hits$`4_Gerritis`,
                        Gerritis_5=hits$`5_Gerritis`,
                        Gerritis_6=hits$`6_Gerritis`,
                        Gerritis_7=hits$`7_Gerritis`,
                        Gerritis_8=hits$`8_Gerritis`,
                        Gerritis_9=hits$`9_Gerritis`,
                        Gerritis_10=hits$`10_Gerritis`,
                        Gerritis_11=hits$`11_Gerritis`,
                        Gerritis_12=hits$`12_Gerritis`,
                        MG0_Sun=hits$MG0_Sun,
                        MG1_Sun=hits$MG1_Sun,
                        MG2_Sun=hits$MG2_Sun,
                        MG3_Sun=hits$MG3_Sun,
                        MG4_Sun=hits$MG4_Sun,
                        MG5_Sun=hits$MG5_Sun,
                        MG6_Sun=hits$MG6_Sun,
                        MG7_Sun=hits$MG7_Sun,
                        MG8_Sun=hits$MG8_Sun,
                        MG10_Sun=hits$MG10_Sun,
                        MG11_Sun=hits$MG11_Sun,
                        MG12_Sun=hits$MG12_Sun,
          
                        
                                  col = list(Gosselin = c("1" ="black", "0"="white"),
                                   Galatro = c("1" ="black", "0"="white"),
                                   aging_Galatro = c("1" ="black", "0"="white"),
                                   down_DAM=c("1" ="black", "0"="white"),
                                   up_DAM=c("1" ="black", "0"="white"),
                                   DAMs_Silvin=c("1" ="black", "0"="white"),
                                   YAMs_Silvin=c("1" ="black", "0"="white"),
                                   DIMs_Silvin=c("1" ="black", "0"="white"),
                                   Mic0_Mathys =c("1" ="black", "0"="white"),
                                   Mic1_Mathys =c("1" ="black", "0"="white"),
                                   Mic2_Mathys =c("1" ="black", "0"="white"),
                                   Mic3_Mathys =c("1" ="black", "0"="white"),
                                   MG1_Olah =c("1" ="black", "0"="white"),
                                   MG2_Olah =c("1" ="black", "0"="white"),
                                   MG3_Olah =c("1" ="black", "0"="white"),
                                   MG4_Olah =c("1" ="black", "0"="white"),
                                   MG5_Olah =c("1" ="black", "0"="white"),
                                   MG6_Olah =c("1" ="black", "0"="white"),
                                   MG7_Olah =c("1" ="black", "0"="white"),
                                   MG8_Olah =c("1" ="black", "0"="white"),
                                   MG9_Olah =c("1" ="black", "0"="white"),
                                   Micro0_Zhou =c("1" ="black", "0"="white"),
                                   Micro1_Zhou =c("1" ="black", "0"="white"),
                                   a_Schirmer =c("1" ="black", "0"="white"),
                                   b_Schirmer =c("1" ="black", "0"="white"),
                                   c_Schirmer =c("1" ="black", "0"="white"),
                                   d_Schirmer =c("1" ="black", "0"="white"),
                                   e_Schirmer =c("1" ="black", "0"="white"),
                                   f_Schirmer =c("1" ="black", "0"="white"),
                                   Gerritis_0 =c("1" ="black", "0"="white"),
                                   Gerritis_1 =c("1" ="black", "0"="white"),
                                   Gerritis_2 =c("1" ="black", "0"="white"),
                                   Gerritis_3 =c("1" ="black", "0"="white"),
                                   Gerritis_4 =c("1" ="black", "0"="white"),
                                   Gerritis_5 =c("1" ="black", "0"="white"),
                                   Gerritis_6 =c("1" ="black", "0"="white"),
                                   Gerritis_7 =c("1" ="black", "0"="white"),
                                   Gerritis_8 =c("1" ="black", "0"="white"),
                                   Gerritis_9 =c("1" ="black", "0"="white"),
                                   Gerritis_10 =c("1" ="black", "0"="white"),
                                   Gerritis_11 =c("1" ="black", "0"="white"),
                                   Gerritis_12 =c("1" ="black", "0"="white"),
                                   MG0_Sun =c("1" ="black", "0"="white"),
                                   MG1_Sun =c("1" ="black", "0"="white"),
                                   MG2_Sun =c("1" ="black", "0"="white"),
                                   MG3_Sun =c("1" ="black", "0"="white"),
                                   MG4_Sun =c("1" ="black", "0"="white"),
                                   MG5_Sun =c("1" ="black", "0"="white"),
                                   MG6_Sun =c("1" ="black", "0"="white"),
                                   MG7_Sun =c("1" ="black", "0"="white"),
                                   MG8_Sun =c("1" ="black", "0"="white"),
                                   MG10_Sun =c("1" ="black", "0"="white"),
                                   MG11_Sun =c("1" ="black", "0"="white"),
                                   MG12_Sun =c("1" ="black", "0"="white")
                        ))

Heatmap(mat_scale,row_order = hits$Gene,cluster_rows = F, cluster_columns = F, col = col_fun,border = T,show_row_names = F,right_annotation =  row_ha,
        row_names_gp = grid::gpar(fontsize = 3))

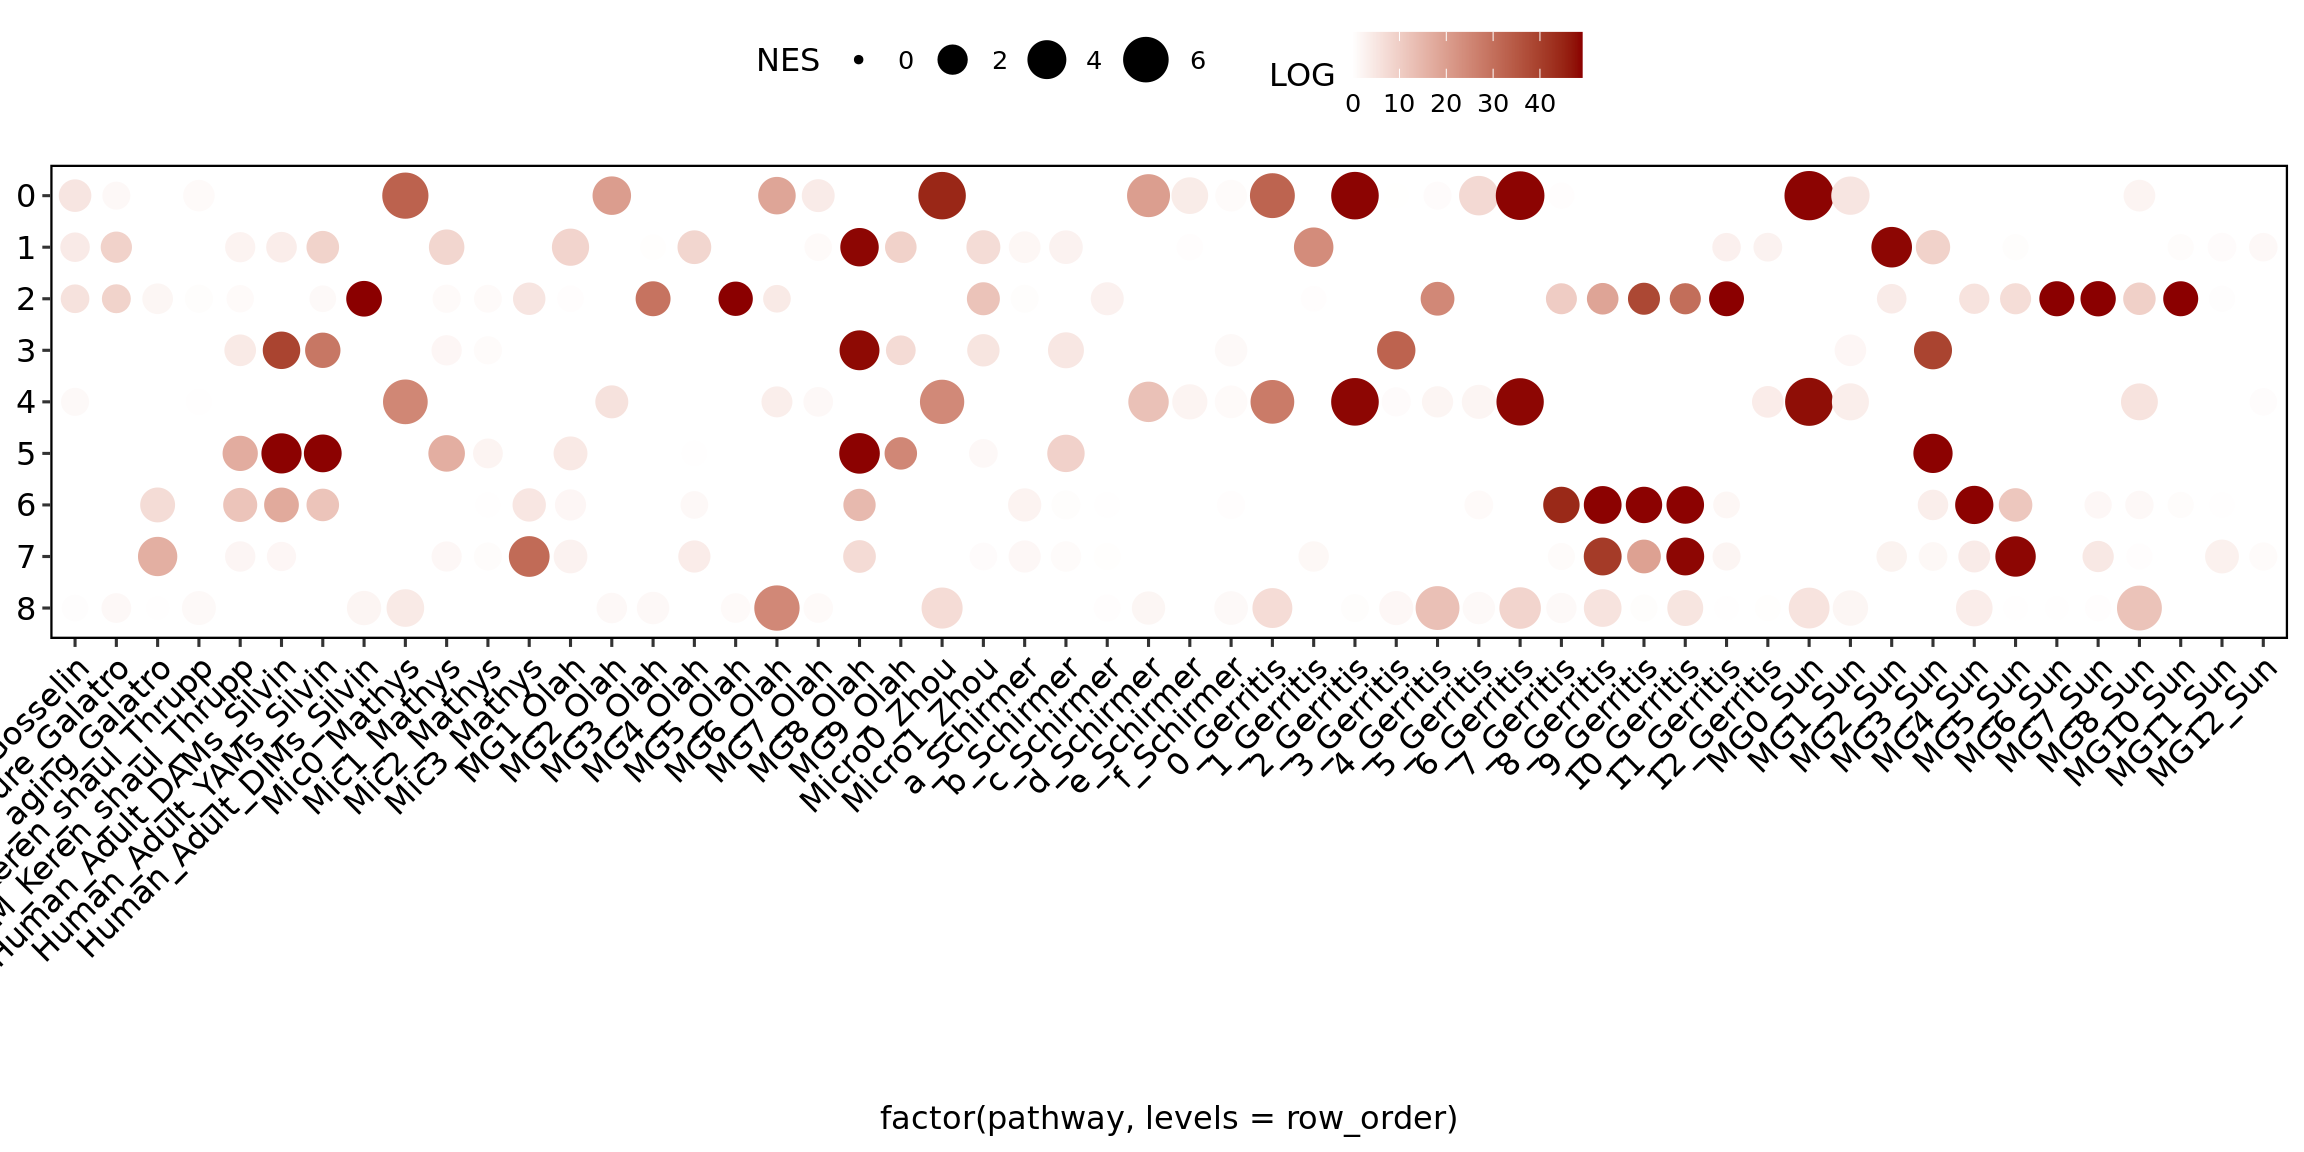
Gene set enrichment analysis (GSEA) of the signatures from the literature within each cluster

GSEA was calculated using the fgsea package. The results from FindAllMarkers with a less significant cutoff were used as cutoff. This intends to account for the broad spectrum of differential expression and not only the significant differentially expressed markers (only.pos = F, min.pct = 0.1, logfc.threshold = 0.0, test.use = “MAST”). Of note, both up and downregulated markers were considered. The avg_log2FC and the p_val_adj were used for ranking.

Humica.markers <- FindAllMarkers(Humica,assay = "RNA", only.pos = F, min.pct = 0.1, logfc.threshold = 0.0, test.use = "MAST") 
genesets <- split(x=genesets$Gene, f=genesets$genesets)

clusterlist <- c("0","1","2","3","4","5","6","7","8")
p <- list()
results <- data.frame()
for (i in 1:length(clusterlist)) {
  print(clusterlist[i])
  genes <- Humica.markers[Humica.markers$cluster==clusterlist[i],]
  genes<- structure(genes$avg_log2FC, names=genes$gene)
  genes <- fgsea(pathways =genesets, 
                 stats    = genes,
                 scoreType ="pos",
                 minSize  = 0,
                 maxSize = Inf)
  genes <- as.data.frame(apply(genes, 2, as.character))
  genes<- as.data.frame(genes) %>% mutate(cluster = clusterlist[i])
  
  results <- rbind(results,genes)
}

Dotplot of the fgsea results

The normalized enrichmant score (NES) and the negative of the logarithm of the p value were used as significance metrics.

results$padj<- as.numeric(results$padj)
results$LOG <- -log10(results$padj)
results$NES <- as.numeric(results$NES)

row_order <- c("Human_microglia_signature_Gosselin","Microglia_signature_Galatro","up_aging_Galatro",
               "down_DAM_Keren_shaul_Thrupp","up_DAM_Keren_shaul_Thrupp",
               "Human_Adult_DAMs_Silvin", "Human_Adult_YAMs_Silvin","Human_Adult_DIMs_Silvin", 
               "Mic0_Mathys","Mic1_Mathys","Mic2_Mathys","Mic3_Mathys",
               "MG1_Olah","MG2_Olah","MG3_Olah","MG4_Olah","MG5_Olah","MG6_Olah","MG7_Olah","MG8_Olah","MG9_Olah",
               "Micro0_Zhou","Micro1_Zhou",
               "a_Schirmer","b_Schirmer","c_Schirmer","d_Schirmer","e_Schirmer","f_Schirmer",
               "0_Gerritis","1_Gerritis","2_Gerritis","3_Gerritis","4_Gerritis","5_Gerritis","6_Gerritis","7_Gerritis","8_Gerritis","9_Gerritis",
               "10_Gerritis","11_Gerritis","12_Gerritis",
               "MG0_Sun","MG1_Sun","MG2_Sun","MG3_Sun","MG4_Sun","MG5_Sun","MG6_Sun","MG7_Sun","MG8_Sun","MG10_Sun","MG11_Sun","MG12_Sun")

ggplot(results, aes(factor(pathway, levels=row_order), factor(cluster, 
                                                              levels = c("8","7","6","5","4","3","2","1","0")),
                                                              colour = LOG)) +
  geom_point(aes(size = NES)) +
  theme_pubr() + 
  scale_size_continuous(range = c(1, 8))+
  scale_color_gradient(low = "white",high = "darkred")+
  scale_shape_manual(values = c(significant = 16, "non-significant" = NA)) +
    border() +
  theme(axis.text.x = element_text(angle = 45, hjust = 1),panel.grid.major = element_blank(), panel.grid.minor = element_blank(), axis.text = element_text(colour="black"),
      axis.title.y = element_blank())